Power of Discrimination
Population statistics for the loci and their various multiplex combinations are listed here. This data was generated at National Institute of Standards and Technology using autosomal and Y- STR data from 1036 individuals. A measure of discrimination often used in paternity analyses is the paternity index (PI), a means for presenting the genetic odds in favor of paternity given the genotypes for the mother, child and alleged father. An alternative calculation used in paternity analyses is the power of exclusion.
List of Tables
- Variation observed across 1036 U.S. population samples with 29 autosomal STR loci and the Y-STR locus DYS391
- Probability of identity values for combined data set and individual population groups
- Probability of identity for various sets of STR loci, which illustrates the resolving power of different STR typing kits on the same DNA samples
- Y-STR locus variability in 1032 males in NIST data set
Variation observed across 1036 U.S. population samples with 29 autosomal STR loci and the Y-STR locus DYS391. Loci are rank ordered by their probability of identity values. The current CODIS 13 core loci are shown in bold font and are underlined. DYS391, as a single-copy Y-STR marker, has no heterozygosity and exhibits the poorest ability to resolve samples from one another.
|
Locus |
Alleles |
Genotypes |
Heterozygosity |
Probability of Identity |
|---|---|---|---|---|
|
SE33 |
52 |
304 |
0.9353 |
0.0066 |
|
Penta E |
23 |
138 |
0.8996 |
0.0147 |
|
D2S1338 |
13 |
68 |
0.8793 |
0.0220 |
|
D1S1656 |
15 |
93 |
0.8890 |
0.0224 |
|
D18S51 |
22 |
93 |
0.8687 |
0.0258 |
|
D12S391 |
24 |
113 |
0.8813 |
0.0271 |
|
FGA |
27 |
96 |
0.8745 |
0.0308 |
|
D6S1043 |
27 |
109 |
0.8494 |
0.0321 |
|
Penta D |
16 |
74 |
0.8552 |
0.0382 |
|
D21S11 |
27 |
86 |
0.8330 |
0.0403 |
|
D8S1179 |
11 |
46 |
0.7992 |
0.0558 |
|
D19S433 |
16 |
78 |
0.8118 |
0.0559 |
|
vWA |
11 |
39 |
0.8060 |
0.0611 |
|
F13A01 |
16 |
56 |
0.7809 |
0.0678 |
|
D7S820 |
11 |
32 |
0.7944 |
0.0726 |
|
D16S539 |
9 |
28 |
0.7761 |
0.0749 |
|
D13S317 |
8 |
29 |
0.7674 |
0.0765 |
|
TH01 |
8 |
24 |
0.7471 |
0.0766 |
|
Penta C |
12 |
49 |
0.7732 |
0.0769 |
|
D2S441 |
15 |
43 |
0.7828 |
0.0841 |
|
D10S1248 |
12 |
39 |
0.7819 |
0.0845 |
|
D3S1358 |
11 |
30 |
0.7519 |
0.0915 |
|
D22S1045 |
11 |
44 |
0.7606 |
0.0921 |
|
F13B |
7 |
20 |
0.6911 |
0.0973 |
|
CSF1PO |
9 |
31 |
0.7558 |
0.1054 |
|
D5S818 |
9 |
34 |
0.7297 |
0.1104 |
|
FESFPS |
12 |
36 |
0.7230 |
0.1128 |
|
LPL |
9 |
27 |
0.7027 |
0.1336 |
|
TPOX |
9 |
28 |
0.6902 |
0.1358 |
|
DYS391 |
7 |
7 |
— |
0.4758 |
Probability of identity values for combined data set and individual population groups.
|
Locus |
Caucasians (N = 361) |
Locus Rank |
African-Americans (N = 342) |
Locus Rank |
Hispanics (N = 236) |
Locus Rank |
Asians (N = 97) |
Locus Rank |
|---|---|---|---|---|---|---|---|---|
|
SE33 |
0.0079 |
(1) |
0.0108 |
(1) |
0.0099 |
(1) |
0.0190 |
(1) |
|
Penta E |
0.0243 |
(4) |
0.0200 |
(2) |
0.0184 |
(2) |
0.0194 |
(2) |
|
D2S1338 |
0.0276 |
(5) |
0.0229 |
(3) |
0.0297 |
(5) |
0.0428 |
(4) |
|
D1S1656 |
0.0211 |
(2) |
0.0338 |
(8) |
0.0284 |
(4) |
0.0481 |
(6) |
|
D18S51 |
0.0305 |
(6) |
0.0280 |
(5) |
0.0303 |
(6) |
0.0507 |
(8) |
|
D12S391 |
0.0237 |
(3) |
0.0373 |
(9) |
0.0332 |
(7) |
0.0473 |
(5) |
|
FGA |
0.0399 |
(7) |
0.0318 |
(7) |
0.0278 |
(3) |
0.0528 |
(9) |
|
D6S1043 |
0.0517 |
(9) |
0.0295 |
(6) |
0.0334 |
(8) |
0.0324 |
(3) |
|
Penta D |
0.0588 |
(10) |
0.0268 |
(4) |
0.0506 |
(10) |
0.0766 |
(13) |
|
D21S11 |
0.0512 |
(8) |
0.0435 |
(11) |
0.0468 |
(9) |
0.0566 |
(10) |
|
D8S1179 |
0.0617 |
(11) |
0.0660 |
(16) |
0.0621 |
(12) |
0.0492 |
(7) |
|
D19S433 |
0.0838 |
(16) |
0.0401 |
(10) |
0.0677 |
(13) |
0.0724 |
(11) |
|
vWA |
0.0660 |
(13) |
0.0623 |
(13) |
0.0730 |
(14) |
0.0885 |
(15) |
|
F13A01 |
0.1164 |
(22) |
0.0637 |
(14) |
0.0783 |
(16) |
0.1935 |
(26) |
|
D7S820 |
0.0628 |
(12) |
0.0889 |
(22) |
0.0867 |
(19) |
0.1006 |
(18) |
|
D16S539 |
0.0983 |
(19) |
0.0733 |
(18) |
0.0762 |
(15) |
0.0928 |
(17) |
|
D13S317 |
0.0777 |
(15) |
0.1342 |
(29) |
0.0526 |
(11) |
0.0766 |
(12) |
|
TH01 |
0.0931 |
(18) |
0.1050 |
(26) |
0.0848 |
(18) |
0.1361 |
(23) |
|
Penta C |
0.1031 |
(21) |
0.0652 |
(15) |
0.0787 |
(17) |
0.1017 |
(19) |
|
D2S441 |
0.0884 |
(17) |
0.1051 |
(27) |
0.1098 |
(22) |
0.1187 |
(22) |
|
D10S1248 |
0.0989 |
(20) |
0.0693 |
(17) |
0.1050 |
(21) |
0.0919 |
(16) |
|
D3S1358 |
0.0758 |
(14) |
0.1090 |
(28) |
0.0904 |
(20) |
0.1485 |
(25) |
|
D22S1045 |
0.1239 |
(23) |
0.0552 |
(12) |
0.1743 |
(29) |
0.1030 |
(20) |
|
F13B |
0.1294 |
(25) |
0.0968 |
(23) |
0.1370 |
(24) |
0.3880 |
(29) |
|
CSF1PO |
0.1285 |
(24) |
0.0827 |
(19) |
0.1255 |
(23) |
0.1040 |
(21) |
|
D5S818 |
0.1486 |
(27) |
0.0983 |
(24) |
0.1457 |
(26) |
0.0788 |
(14) |
|
FESFPS |
0.1444 |
(26) |
0.0847 |
(20) |
0.1405 |
(25) |
0.1474 |
(24) |
|
LPL |
0.1516 |
(28) |
0.1028 |
(25) |
0.1549 |
(27) |
0.2854 |
(28) |
|
TPOX |
0.1811 |
(29) |
0.0879 |
(21) |
0.1554 |
(28) |
0.2188 |
(27) |
|
DYS391 |
0.4430 |
(30) |
0.5603 |
(30) |
0.4411 |
(30) |
0.6992 |
(30) |
Probability of identity for various sets of STR loci, which illustrates the resolving power of different STR typing kits on the same DNA samples.
|
STR Kit or Core Set of Loci |
Total N=1036 |
361 Caucasians |
342 African |
236 Hispanics |
97 Asians |
|---|---|---|---|---|---|
|
CODIS 13 |
5.02 × 10⁻¹⁶ |
2.97 × 10⁻¹⁵ |
1.14 × 10⁻¹⁵ |
1.36 × 10⁻¹⁵ |
1.71 × 10⁻¹⁴ |
|
Identifiler® |
6.18 × 10⁻¹⁹ |
6.87 × 10⁻¹⁸ |
1.04 × 10⁻¹⁸ |
2.73 × 10⁻¹⁸ |
5.31 × 10⁻¹⁷ |
|
PowerPlex® 16 |
2.82 × 10⁻¹⁹ |
4.24 × 10⁻¹⁸ |
6.09 × 10⁻¹⁹ |
1.26 × 10⁻¹⁸ |
2.55 × 10⁻¹⁷ |
|
PowerPlex® 18D |
3.47 × 10⁻²² |
9.82 × 10⁻²¹ |
5.60 × 10⁻²² |
2.54 × 10⁻²¹ |
7.92 × 10⁻²⁰ |
|
|
|||||
|
ESS 12 |
3.04 × 10⁻¹⁶ |
9.66 × 10⁻¹⁶ |
9.25 × 10⁻¹⁶ |
2.60 × 10⁻¹⁵ |
3.42 × 10⁻¹⁴ |
|
PowerPlex® ESI 16 / ESX 16 / NGM™ |
2.80 × 10⁻²⁰ |
2.20 × 10⁻¹⁹ |
6.23 × 10⁻²⁰ |
4.03 × 10⁻¹⁹ |
9.83 × 10⁻¹⁸ |
|
PowerPlex® ESI 17 / ESX 17 / NGM SElect™ |
1.85 × 10⁻²² |
1.74 × 10⁻²¹ |
6.71 × 10⁻²² |
3.97 × 10⁻²¹ |
1.87 × 10⁻¹⁹ |
|
|
|||||
|
CODIS 20 |
9.35 × 10⁻²⁴ |
7.32 × 10⁻²³ |
6.12 × 10⁻²³ |
8.43 × 10⁻²³ |
4.22 × 10⁻²¹ |
|
GlobalFiler™ |
7.73 × 10⁻²⁸ |
1.30 × 10⁻²⁶ |
3.20 × 10⁻²⁷ |
2.27 × 10⁻²⁶ |
1.81 × 10⁻²⁴ |
|
PowerPlex® Fusion |
6.58 × 10⁻²⁹ |
2.35 × 10⁻²⁷ |
1.59 × 10⁻²⁸ |
2.12 × 10⁻²⁷ |
1.42 × 10⁻²⁵ |
|
|
|||||
|
PowerPlex® 21 |
6.77 × 10⁻²⁷ |
2.53 × 10⁻²⁵ |
2.08 × 10⁻²⁶ |
7.98 × 10⁻²⁶ |
5.85 × 10⁻²⁴ |
|
PowerPlex® CS7 |
4.30 × 10⁻⁹ |
4.86 × 10⁻⁸ |
1.87 × 10⁻⁹ |
1.71 × 10⁻⁸ |
4.79 × 10⁻⁷ |
|
Profiler Plus™ |
6.11 × 10⁻¹² |
1.39 × 10⁻¹¹ |
2.03 × 10⁻¹¹ |
1.08 × 10⁻¹¹ |
5.96 × 10⁻¹¹ |
|
COfiler® |
5.45 × 10⁻⁷ |
1.01 × 10⁻⁶ |
5.42 × 10⁻⁷ |
9.89 × 10⁻⁷ |
4.30 × 10⁻⁶ |
|
SGM Plus® |
7.04 × 10⁻¹⁴ |
4.07 × 10⁻¹³ |
1.23 × 10⁻¹³ |
2.10 × 10⁻¹³ |
3.84 × 10⁻¹² |
|
SEfiler Plus™ |
4.65 × 10⁻¹⁶ |
3.22 × 10⁻¹⁵ |
1.32 × 10⁻¹⁵ |
2.09 × 10⁻¹⁵ |
7.31 × 10⁻¹⁴ |
|
SinoFiler™ |
5.16 × 10⁻²⁰ |
4.98 × 10⁻¹⁹ |
1.25 × 10⁻¹⁹ |
2.29 × 10⁻¹⁹ |
2.73 × 10⁻¹⁸ |
|
MiniFiler™ |
3.09 × 10⁻¹¹ |
1.06 × 10⁻¹⁰ |
6.40 × 10⁻¹¹ |
5.12 × 10⁻¹¹ |
4.84 × 10⁻¹⁰ |
|
|
|||||
|
All 29 autosomal STRs |
2.24 × 10–37 |
7.36 × 10⁻³⁵ |
3.16 × 10–37 |
2.93 × 10⁻³⁵ |
4.02 × 10⁻³² |
|
29 autosomal STRs + DYS391 |
1.07 × 10–37 |
3.26 × 10⁻³⁵ |
1.77 × 10–37 |
1.29 × 10⁻³⁵ |
2.81 × 10⁻³² |
Relative positions of 23 Y-STR loci available in the PowerPlex® Y23 System.
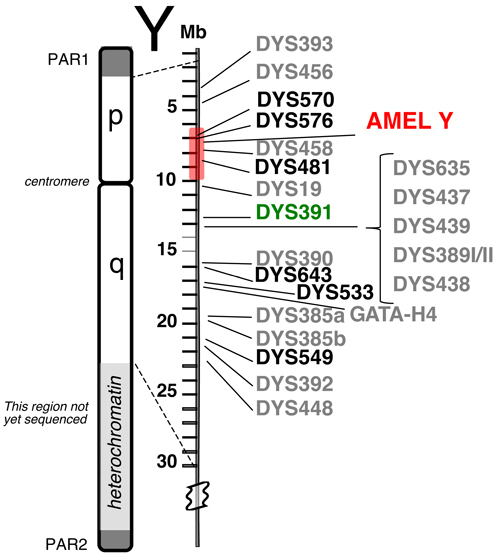
The six new loci are shown in bold font. PAR1 and PAR2 are pseudo-autosomal regions on the tips of the Y chromosome that recombine with the X chromosome. The shaded region around AMEL Y can sometimes be deleted, causing loci such as DYS458 to be missing from an otherwise full Y-STR profile. DYS391 is located a sufficient distance away to avoid deletions affecting AMEL Y.
Y-STR locus variability in 1032 males in NIST data set. There are 17 different alleles seen in the data set for DYS385 in 69 combinations of the “a” and “b” amplicons. Numbers highlighted in red include a deletion null allele. The six new loci present in PowerPlex® Y23 are in bold font.
|
Locus |
Alleles Observed |
PI (Total) |
PI (Caucasian) |
Rank |
PI (African American) |
Rank |
PI (Hispanic) |
Rank |
PI (Asian) |
Rank |
|---|---|---|---|---|---|---|---|---|---|---|
|
DYS385a/b |
17 (69) |
0.0700 |
0.1482 |
(1) |
0.0608 |
(1) |
0.0815 |
(1) |
0.0549 |
(1) |
|
DYS481 |
16 |
0.1670 |
0.2653 |
(6) |
0.1401 |
(2) |
0.2033 |
(4) |
0.1765 |
(2) |
|
DYS576 |
9 |
0.1922 |
0.2292 |
(2) |
0.1917 |
(3) |
0.2020 |
(3) |
0.2392 |
(7) |
|
DYS570 |
12 |
0.2161 |
0.2575 |
(4) |
0.2085 |
(4) |
0.2008 |
(2) |
0.1895 |
(4) |
|
DYS458 |
15 |
0.2166 |
0.2352 |
(3) |
0.2410 |
(6) |
0.2144 |
(5) |
0.1825 |
(3) |
|
DYS390 |
8 |
0.2242 |
0.2966 |
(7) |
0.3233 |
(11) |
0.3605 |
(16) |
0.2480 |
(8) |
|
DYS643 |
10 |
0.2373 |
0.3790 |
(12) |
0.2130 |
(5) |
0.3292 |
(13) |
0.2639 |
(9) |
|
DYS635 |
11 |
0.2421 |
0.3313 |
(9) |
0.2778 |
(9) |
0.2604 |
(6) |
0.2769 |
(11) |
|
DYS389II |
12 |
0.2541 |
0.3157 |
(8) |
0.2623 |
(7) |
0.2711 |
(7) |
0.2054 |
(5) |
|
DYS448 |
16 |
0.2650 |
0.3904 |
(13) |
0.2789 |
(10) |
0.2982 |
(8) |
0.2739 |
(10) |
|
DYS438 |
7 |
0.2861 |
0.3942 |
(14) |
0.4311 |
(18) |
0.3046 |
(9) |
0.4201 |
(16) |
|
DYS19 |
10 |
0.2996 |
0.4860 |
(21) |
0.2746 |
(8) |
0.3308 |
(14) |
0.2384 |
(6) |
|
DYS549 |
7 |
0.3095 |
0.3656 |
(11) |
0.3325 |
(12) |
0.3354 |
(15) |
0.3540 |
(14) |
|
DYS456 |
8 |
0.3098 |
0.2629 |
(5) |
0.3571 |
(14) |
0.3072 |
(10) |
0.4322 |
(20) |
|
DYS439 |
11 |
0.3460 |
0.3627 |
(10) |
0.3502 |
(13) |
0.3124 |
(11) |
0.4004 |
(15) |
|
DYS533 |
7 |
0.3654 |
0.4119 |
(16) |
0.3775 |
(15) |
0.3857 |
(19) |
0.4220 |
(18) |
|
DYS392 |
11 |
0.3752 |
0.4024 |
(15) |
0.5546 |
(21) |
0.3170 |
(12) |
0.3445 |
(13) |
|
DYS437 |
8 |
0.3800 |
0.4289 |
(18) |
0.4950 |
(20) |
0.3778 |
(17) |
0.6248 |
(21) |
|
Y-GATA-H4 |
6 |
0.3957 |
0.4286 |
(17) |
0.3842 |
(16) |
0.3983 |
(20) |
0.4203 |
(17) |
|
DYS389I |
8 |
0.4203 |
0.4546 |
(20) |
0.4808 |
(19) |
0.3805 |
(18) |
0.3232 |
(12) |
|
DYS391 |
7 |
0.4758 |
0.4430 |
(19) |
0.5603 |
(22) |
0.4411 |
(21) |
0.6992 |
(22) |
|
DYS393 |
6 |
0.5018 |
0.6020 |
(22) |
0.4169 |
(17) |
0.5582 |
(22) |
0.4231 |
(19) |
References
Coble, M.D., Hill, C.R., Butler J.M. (2013) Haplotype data for 23 Y-chromosome markers in four U.S. population groups. Forensic Sci. Int. Genet. 7, e66–e68.
Hill, C.R., Duewer, D.L., Kline, M.C., Coble, M.D., Butler, J.M. (2013) U.S. population data for 29 autosomal STR loci. Forensic Sci. Int. Genet. 7, e82–e83.
Butler, J.M., Hill, C.R., Coble, M.D. (2012) Variability of new STR loci and kits in U.S. population groups. Profiles in DNA. Available at: www.promega.com/resources/articles/profiles-in-dna/2012/variability-of-new-str-loci-and-kits-in-us-population-groups/.